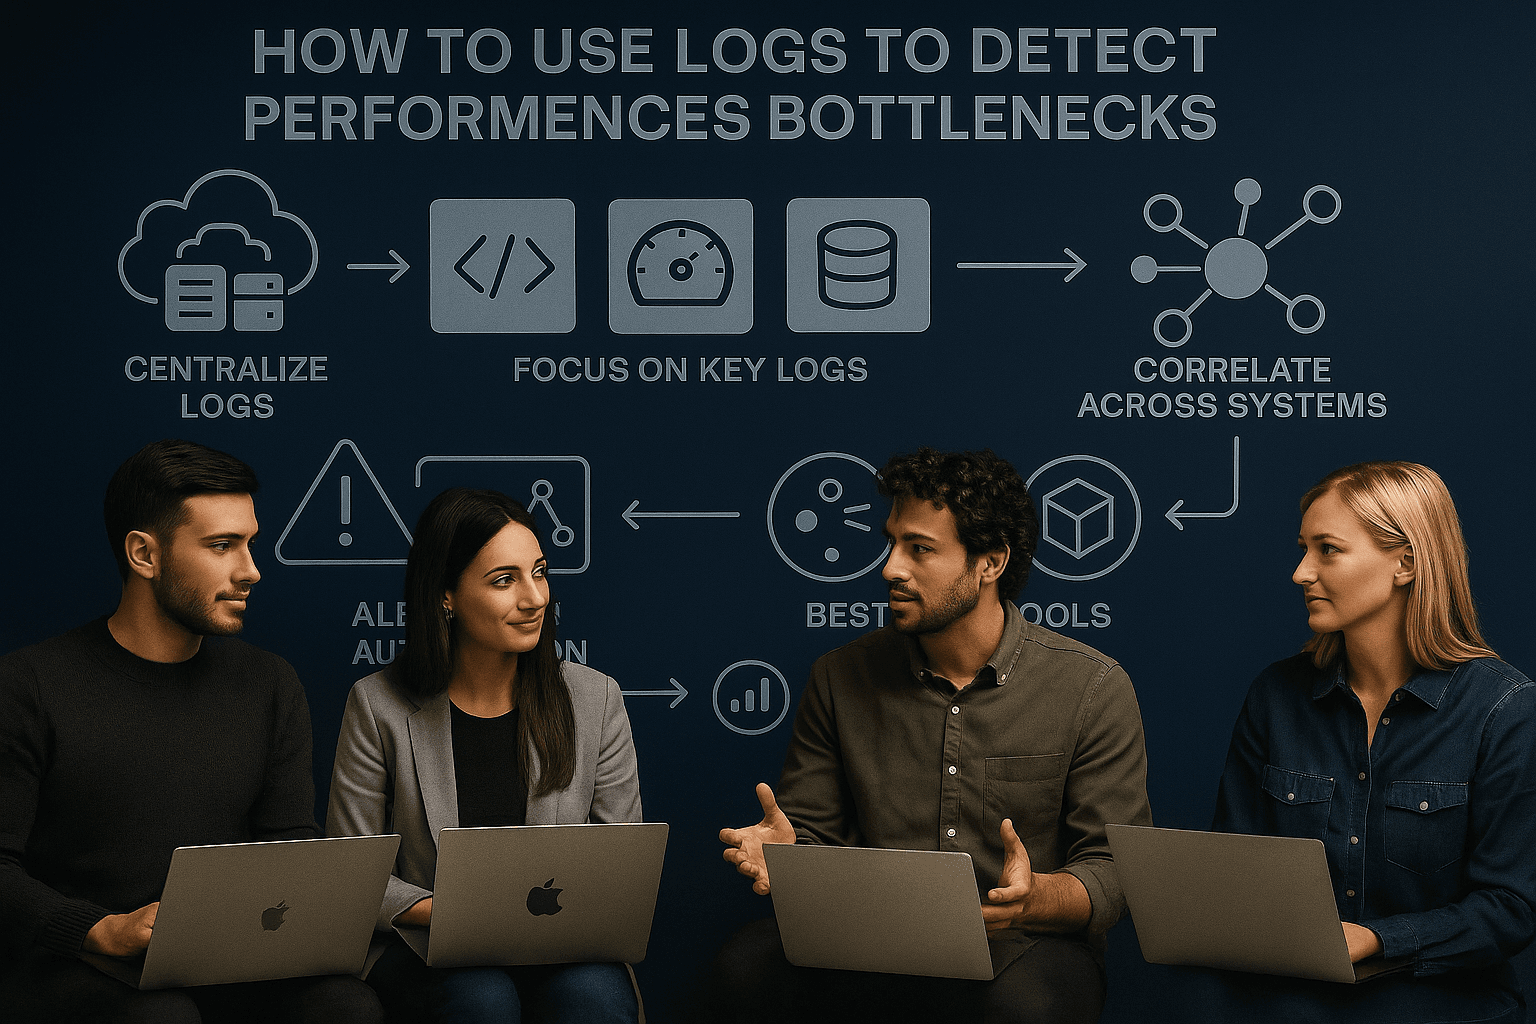
Your logs hold the answers to your system's performance issues. When your app slows down or users face timeouts, logs can help you pinpoint the bottleneck - whether it's high CPU usage, slow database queries, or overloaded APIs. Here's how to use logs effectively:
Centralize Log Collection: Gather logs from all sources into one system for easy analysis.
Focus on Key Log Types: Use application logs (errors, response times), server logs (CPU, memory), and database/API logs to identify slow operations.
Spot Patterns and Anomalies: Look for trends in metrics like response times or error spikes to detect issues early.
Correlate Events Across Systems: Connect the dots between logs to find the root cause of bottlenecks.
Set Alerts and Automate Fixes: Configure alerts for threshold breaches and use automation tools to resolve issues faster.
Proper log analysis helps you fix issues quickly and optimize performance without guesswork. Whether you're a startup or an enterprise, using logs effectively can save time, money, and user frustration.
DevOps Quick Bites - Debug Log Analysis
Key Types of Logs
When it comes to understanding your system's performance, not all logs are created equal. Each type plays a distinct role in uncovering insights and identifying bottlenecks.
"Logs are more than just data - they are critical tools for your tech team." - Anjali Udasi, Author at Last9
Application Logs
Application logs dive into the details of your code, capturing essential events that aid in troubleshooting.
Request and response times: These timestamps show how long operations take, making it easier to identify slow endpoints. By analyzing these metrics, you can pinpoint delays caused by database queries, API calls, or processing logic.
Error and stack traces: These logs expose failures and their origins. When error rates spike, they often signal performance issues that could affect your application's ability to handle load.
Change logs: These track modifications like user additions or permission updates. They’re especially helpful for correlating performance issues with recent deployments or configuration changes.
Server and Resource Utilization Logs
Server logs provide a snapshot of your system's health by monitoring CPU, memory, disk, and network usage. These logs are critical for spotting resource-related bottlenecks.
CPU usage metrics: High CPU usage can indicate that a server is struggling with its workload, potentially leading to slowdowns or crashes. Regular monitoring across servers ensures optimal performance.
Memory usage logs: These help identify issues like memory leaks or inefficient allocation. High memory consumption can slow down operations or even crash applications.
Network and disk I/O logs: These logs highlight challenges in data transfer and storage. For instance, slow disk reads or network timeouts might surface here before they impact users. High error rates in these logs can also point to software bugs, configuration problems, or hardware failures.
Database and API Gateway Logs
These logs offer insights into how your database and APIs handle workloads.
Database logs: By capturing query execution times, these logs help detect slow queries and locks. They’re invaluable for identifying inefficient database operations.
API gateway logs: These logs track key metrics like response time, latency, failed request rate, throughput, and availability. Response time measures how quickly the API replies, while latency indicates the delay between sending a request and receiving the first byte of the response.
Access logs: These document server requests, providing a window into user behavior and potential performance issues.
Logs and Metrics: A Unified Perspective
Logs and metrics work hand in hand to give you a complete view of system performance. While logs capture specific events, metrics offer a broader perspective by quantifying performance over time. Together, they make it easier to pinpoint the root causes of performance bottlenecks. This understanding lays the groundwork for systematic log analysis, which will be explored further in the next section.
Step-by-Step Log Analysis Guide
Turn your logs into actionable insights by following a structured approach to log analysis.
Centralizing Log Collection
The first step in effective log analysis is consolidating your logs in one central location. A centralized logging system simplifies data aggregation, processing, storage, and analysis, making it far easier to manage logs from multiple sources.
Your system should handle log collection, storage, and analysis while offering visualization tools. Tools like Logstash, Filebeat, or fluentd can help gather logs depending on your environment.
Before collecting logs, clean and preprocess them to focus on capturing only the most relevant data. Use log filtering to ensure only necessary information is sent to your central system. Implement policies for rotating and deleting older logs to avoid storage issues. Encryption is also essential - secure your logs both in transit and at rest, and limit access to authorized users only. With centralized logs, you can easily sift through and focus on the data that truly matters.
Filtering and Searching Logs
Once your logs are centralized, the next step is filtering and searching for key information. Structured logging formats like JSON or XML make it easier to filter and query logs. Including meaningful details - like timestamps, user request IDs, and unique identifiers - can make searches more precise.
Unstructured logs, such as Nginx error messages, can be converted into structured formats to streamline filtering and querying. Treat your logs like data by filtering them based on fields such as request IDs, user IDs, URL paths, or error codes. Tools like Kibana Query Language (KQL) can also enhance your search capabilities with advanced full-text search features.
Identifying Patterns and Anomalies
Log analysis truly shines when you start spotting patterns and anomalies. Look for trends in metrics like response times, error rates, or resource usage that deviate from the norm. Indexing your logs for faster querying can make this process more efficient, even with large datasets.
Dashboards and real-time alerting systems are invaluable for monitoring logs. They help you catch performance issues - like sudden error spikes or gradual response time increases - before they escalate. Focus on the metrics most critical to your system’s performance to stay ahead of potential problems.
Correlating Events Across Systems
When anomalies arise, the next step is correlating events across systems to identify root causes. Event correlation helps you connect the dots between events across your infrastructure, revealing patterns and uncovering how issues spread. This process transforms raw log data into actionable insights.
For example, a global technology services provider reduced their Mean Time to Resolution (MTTR) by 58% in just 30 days by implementing event correlation.
To do this effectively, aggregate monitoring data from different tools into a single platform. Filter out irrelevant events, deduplicate repetitive notifications, and normalize data into a consistent format. This makes it easier to trace issues across applications, databases, and networks.
"IT event correlation is 'finding relationships between two or more log entries.'" - NIST
Setting Up Alerts and Automation
Finally, set up intelligent alerts to notify you when performance thresholds are breached. Alerts can be configured to trigger for specific log conditions, such as errors or security threats.
Modern systems can automate responses to common issues, cutting down on manual intervention and speeding up resolution times. AI-driven machine learning tools can assist by identifying patterns and performing root-cause analysis faster than human operators. Considering that unplanned downtime can cost over $14,500 per minute - and up to $23,750 per minute for larger organizations - automation is a valuable investment.
To keep your log analysis system effective, establish clear policies for log collection, retention, and secure access. Regularly monitor your infrastructure and update your policies as your system evolves to meet new demands.
sbb-itb-2511131
Tools and Techniques for Log Analysis
Log analysis tools are designed to simplify data collection and alerting, helping teams identify and address issues before they impact users. Modern tools streamline everything from gathering logs to providing intelligent alerts, making troubleshooting faster and more efficient.
Popular Log Management Tools
SigNoz is a unified observability platform that integrates logs, metrics, and traces into a single interface. Built on ClickHouse, it boasts speeds up to 2.5 times faster than Elasticsearch while consuming 50% fewer resources. Additionally, SigNoz can reduce costs by up to 45% compared to Grafana.
Grafana is a powerful visualization tool that connects to various data sources like Prometheus and New Relic. It offers customizable dashboards and rich visualizations but requires additional tools for data collection and has a steeper learning curve.
Prometheus excels in time-series data collection and alerting. It features a robust query language, automatic service discovery, and horizontal scalability. However, it lacks built-in long-term storage and has limited support for distributed tracing.
New Relic offers a cloud-based observability platform with end-to-end monitoring capabilities. It provides real-time analytics, distributed tracing, and automatic instrumentation, but its higher costs and limited customization for metrics may not suit all budgets.
Other noteworthy tools include Splunk, Graylog, Sumo Logic, Elasticsearch, Datadog, and Sematext. Each has unique strengths, making it easier to choose based on your specific needs.
Choosing the Right Tool
Choosing the best log analysis tool depends on several factors. First, decide between open-source and proprietary solutions based on your budget and requirements. Evaluate how well the tool integrates with your existing tech stack and whether it scales effectively with your data volume and retention needs. A user-friendly interface and clear dashboards are also important, especially when working with complex datasets. Additionally, consider the tool’s performance and cost implications for handling large-scale data. Finally, ensure it meets your security, compliance, and support standards. The right tool can make log analysis more efficient and help you quickly identify and resolve bottlenecks.
Log Analysis Tool Comparison
Here’s a quick comparison of popular log analysis tools to help you decide which one fits your needs best:
Tool
Strengths
Pricing
Best For
SigNoz
Faster than Elasticsearch, unified observability
Open source available
Unified logs, metrics, and traces
Grafana
Customizable visualizations, multiple data sources
Free tier available
Flexible visualization needs
Prometheus
Lightweight, automatic discovery, strong query language
Open source
Time-series monitoring
New Relic
Full-stack monitoring, real-time analytics
Free tier: 100GB/month, premium on request
Comprehensive observability
Datadog
Advanced features, strong integrations
Starts at $0.10/GB/month
Enterprise environments
Sematext
Affordable, flexible retention options
Starts at $5/month
Small to medium businesses
These tools vary in their architecture and capabilities. For instance, Grafana uses multiple backends like Loki, Tempo, and Mimir, while SigNoz opts for a single datastore to correlate logs, metrics, and traces efficiently. Prometheus is ideal for time-series metrics, whereas the ELK Stack specializes in log analysis and search.
An effective log analysis tool should offer features like real-time log ingestion, advanced search and filtering, intuitive dashboards, intelligent alerting, machine learning-driven anomaly detection, and seamless integration with other systems. The best choice will depend on your infrastructure, budget, and specific performance needs.
Conclusion
Our step-by-step guide highlights how systematic log analysis transforms performance optimization from a reactive scramble into a proactive strategy. By centralizing log collection, applying intelligent monitoring, and following a structured workflow, you lay the groundwork for maintaining high-performing applications that can scale with your business.
Log Analysis Workflow Summary
When done right, a well-structured log analysis process delivers tangible results. Centralized log collection eliminates data silos, while intelligent filtering ensures your team focuses on actionable insights instead of sifting through irrelevant noise. These practices emphasize the critical role logs play in ongoing optimization.
The numbers speak for themselves: proper indexing can improve query speeds by up to 300%, while effective caching can slash response times by up to 100 times. Even shifting from HTTP/1.1 to HTTP/2 can improve loading speeds by as much as 40%.
Take this example: a payment processor used log analysis to uncover high CPU usage on their database server, which was causing slow queries, delayed payment processing, and gateway timeouts. By scaling database resources, optimizing queries, and implementing load balancing, they resolved the issue - all thanks to systematic log analysis.
"Understanding your system's log files is essential when conducting IT systems monitoring, troubleshooting, or performance optimization." - Austin Chia, Data Analyst, Any Instructor
Continuous monitoring of server response times, database health, and resource usage allows teams to tackle issues before they escalate. Setting clear logging objectives and conducting regular reviews ensures you extract actionable insights rather than getting lost in data overload.
When it comes to backend performance optimization, expert guidance can make all the difference. This is where Propelius Technologies stands out. With experience delivering over 100 projects across modern tech stacks like React.js, Node.js, and Supabase/Firebase, our team specializes in identifying and resolving performance bottlenecks.
Our Developer-for-Hire model embeds senior engineers directly into your team, providing immediate expertise in log analysis and backend optimization. For more comprehensive needs, our Turnkey Delivery approach offers end-to-end solutions. With over a decade of leadership experience in SF-Bay startups, our CEO ensures we don’t just fix problems - we build scalable, long-term monitoring and logging infrastructures.
For startups, our 90-Day MVP Sprint includes built-in performance optimization and monitoring setup, so your application launches with proper observability from day one. Plus, with delay discounts of 10% per week (up to 50%), we share the risk, showing our commitment to delivering results on time.
Performance issues don’t wait for the perfect moment to appear. Whether you’re facing urgent challenges or planning for long-term success, Propelius Technologies offers the expertise and proven strategies to elevate your backend performance. Let us help you turn challenges into opportunities for growth.
FAQs
How does centralizing log data help identify performance bottlenecks more efficiently?
Centralizing log data streamlines operations by offering a single, unified view of logs from all your systems, services, and APIs. This unified approach simplifies tracking down issues like slow response times or transaction failures across your backend. For instance, you can use unique identifiers - such as order IDs - to trace a transaction's path through various services, helping you quickly identify where delays or errors are occurring.
Beyond immediate troubleshooting, centralized logging unlocks access to historical data, which is crucial for identifying trends, recurring problems, or gradual performance dips over time. This method not only speeds up debugging but also allows your team to dive deeper into analysis. As a result, they can spend less time firefighting and more time driving innovation and tackling high-priority projects.
What are the best ways to filter and search logs to quickly find performance bottlenecks?
To identify performance bottlenecks quickly, start by using structured logging, such as logs in JSON format. This approach makes your data easier to search and analyze. It's also crucial to centralize logs from all system components into a single platform. This way, you can get a complete picture of your system's performance.
Leverage log levels like INFO, WARN, and ERROR to prioritize issues that need immediate attention. Set up alerts to flag unusual patterns or sudden spikes in log activity. Additionally, make it a habit to review and adjust your logging setup regularly. This helps prevent an overload of unnecessary data, which can slow down your analysis. By following these practices, you can quickly pinpoint and address performance issues in your system.
Why is correlating events across systems important for identifying performance bottlenecks?
Understanding how events across various systems are connected is key to pinpointing performance issues. It helps reveal patterns and links between problems that might initially seem unrelated. By tying these events together, you can zero in on the root cause faster and avoid getting sidetracked by individual symptoms.
Take this example: a failing database query could set off multiple alerts throughout your infrastructure. Event correlation brings these alerts together, showing their common cause, so your team can focus on fixing the actual problem. This approach not only speeds up the troubleshooting process but also cuts down on unnecessary alerts, making your systems more reliable and your operations smoother.
Need an expert team to provide digital solutions for your business?