SaaS Observability: Error Tracking, Logging, and Performance Monitoring
In production SaaS applications, you're flying blind without observability. When a customer reports "it's slow" or "something broke," you need to know exactly what happened, where, and why — without asking them to reproduce it. That's what observability delivers: visibility into your system's internal state through the data it produces.
At Propelius Technologies, we've debugged thousands of production issues across 650+ applications. This guide covers the three pillars of SaaS observability — error tracking, logging, and performance monitoring — and how to implement them effectively.
Photo by AS Photography on Pexels
The Three Pillars of Observability
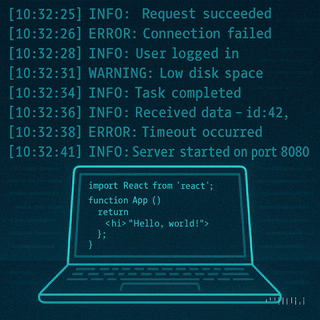
1. Logs: The Event Timeline
Logs are timestamped records of discrete events — user actions, system events, errors, warnings. They answer "what happened and when?"
What to log:
User authentication attempts (success/failure)
API requests (endpoint, user, status code, duration)
PII unless absolutely necessary (and redact where possible)
Credit card numbers or sensitive payment data
Medical records or other regulated data
2. Metrics: The Pulse Check
Metrics are numerical measurements sampled over time — request count, response time, memory usage. They answer "how is the system performing?"
Essential SaaS metrics:
Request rate: Requests per second/minute
Error rate: 4xx and 5xx responses as percentage of total
Latency: P50, P95, P99 response times
Throughput: Data transferred per second
CPU & memory: Usage per container/instance
Database: Connection pool size, query duration, slow queries
Queue depth: Pending background jobs
3. Traces: The Journey Map
Traces follow a single request through your entire system — across services, databases, caches, and external APIs. They answer "where is the bottleneck?"
In microservices architectures, a user action might touch 10+ services. Distributed tracing shows the entire call chain with timing for each hop.
Photo by Markus Spiske on Pexels
Error Tracking: Catching Issues Before Users Report Them
Error tracking tools capture exceptions, group them intelligently, and alert your team when new issues appear or known issues spike.
What Makes Good Error Tracking
Stack traces: Full call stack with file names and line numbers
Context: User ID, session ID, request parameters, environment variables
Breadcrumbs: Recent user actions leading up to the error
Grouping: Intelligent deduplication of similar errors
Alerts: Slack/email/PagerDuty when new errors appear or rates spike
Source maps: Unminify JavaScript for readable frontend errors
Error Tracking Tools Comparison
Tool
Best For
Pricing
Key Features
Sentry
Full-stack apps
Free tier, $26+/month
Best breadcrumbs, release tracking, session replay
Rollbar
Backend-heavy apps
Free tier, $25+/month
RQL queries, telemetry, deploy tracking
Bugsnag
Mobile + web
$59+/month
Stability scores, release health
Airbrake
Ruby/Rails apps
$49+/month
Performance monitoring included
LogRocket
Frontend debugging
$99+/month
Session replay + console logs
Propelius recommendation: Start with Sentry. It has the best free tier, excellent SDKs for 30+ languages, and the right balance of features vs. complexity.
Logging Systems: Capturing the Event Stream
Centralized logging means all your logs flow to one place where you can search, filter, and analyze them.
Structured vs Unstructured Logging
Unstructured (old way):
2026-02-24 19:00:00 INFO User john@example.com logged in from 192.168.1.1
Generate a unique ID for each request and include it in every log entry, error, and trace. This lets you reconstruct the entire user journey across services.
Avoid Alert Fatigue
Only alert on:
New error types (not already acknowledged)
Error rate above threshold (not single occurrences)
Critical metrics degradation (P95 latency >2s)
System health checks failing
Too many alerts = ignored alerts = missed incidents.
Set Retention Policies
Storage costs add up fast. Typical retention:
Errors: 90 days (or until resolved)
Logs: 7-30 days for detailed logs, 1 year for aggregated
Metrics: Raw for 30 days, downsampled for 1 year
Traces: Sample 1-10%, keep 7 days
FAQs
Do I need error tracking, logging, AND performance monitoring?
Start with error tracking (Sentry) and basic logging. Add performance monitoring once you have 50+ customers and can afford $100+/month. All three together give you complete visibility, but error tracking is non-negotiable from day one.
How much does observability cost at scale?
Budget 2-5% of infrastructure spend. For a company spending $10K/month on servers, expect $200-500/month on observability tools. Datadog or New Relic can hit $1,000-5,000/month at significant scale.
Should I log to files or stdout?
Log to stdout and let your container orchestration (Kubernetes, ECS, Docker) capture it. This is the 12-factor app pattern and makes centralization trivial. Avoid writing to disk unless you're on bare metal or VMs.
What's the difference between APM and RUM?
APM (Application Performance Monitoring) measures server-side performance. RUM (Real User Monitoring) measures client-side performance from actual user browsers. You need both — APM shows backend bottlenecks, RUM shows frontend rendering and network latency.
Can I self-host everything instead of paying for SaaS tools?
Yes, using ELK Stack (logs), Prometheus + Grafana (metrics), and Jaeger (traces). You'll save on tool costs but pay for engineering time, server capacity, and maintenance. SaaS tools are worth it unless you have dedicated DevOps team or strict data residency requirements.
Conclusion
Observability isn't optional for production SaaS applications — it's the difference between debugging in minutes vs. hours, and catching issues before customers notice vs. after they churn.
Start simple: Sentry + basic logging. Add complexity as you grow and can afford the tooling and engineering time.
Instrument everything: Every API endpoint, database query, external call, and user action should generate telemetry.
Alert wisely: Only page on what matters. Everything else can wait for morning.
At Propelius Technologies, we build observability into every SaaS application from day one. Our 30-day MVP sprints include Sentry integration, structured logging, and basic performance monitoring as standard. Schedule a consultation to discuss your observability needs.
Need an expert team to provide digital solutions for your business?